Register Percepio View
Register your Percepio View here to access these extra features for free.
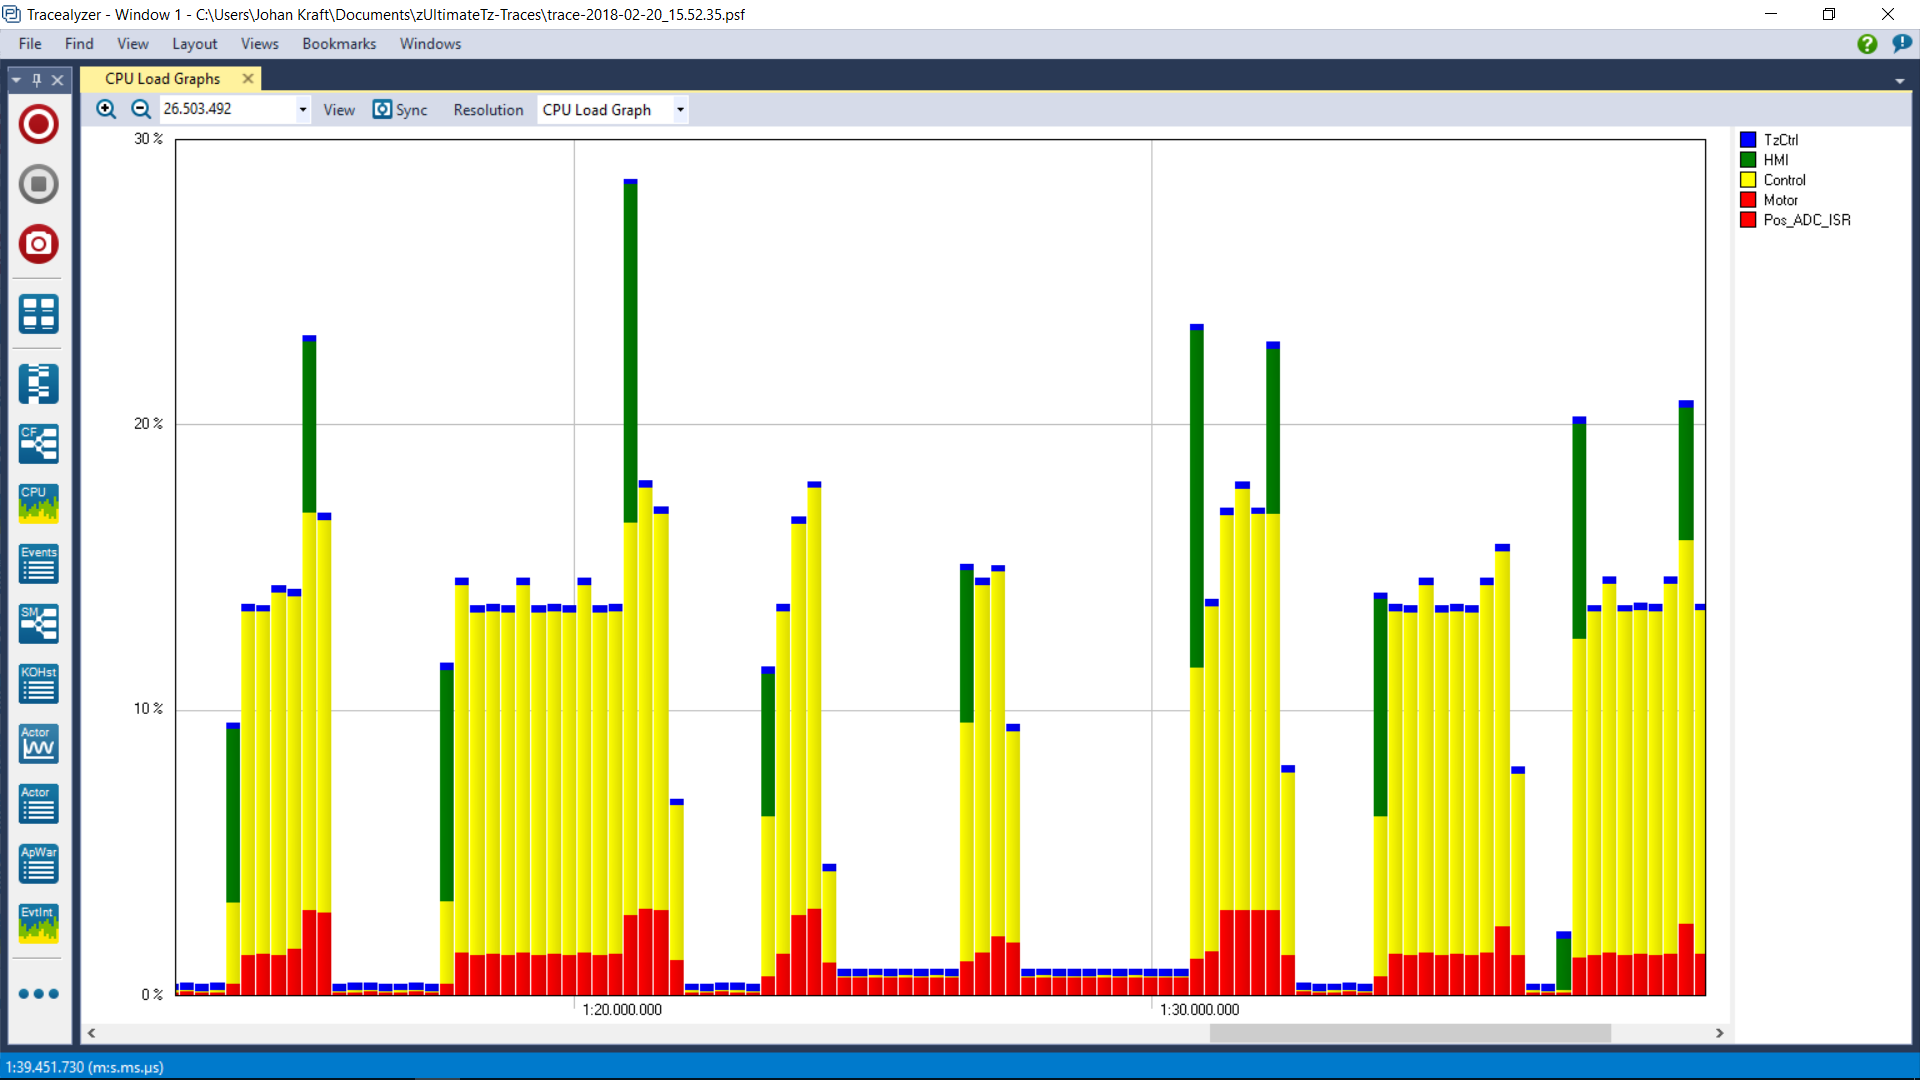 CPU Load Graph
See the percentage of processor time used by each thread and traced interrupt handlers over time. Find hotspots and zoom in.
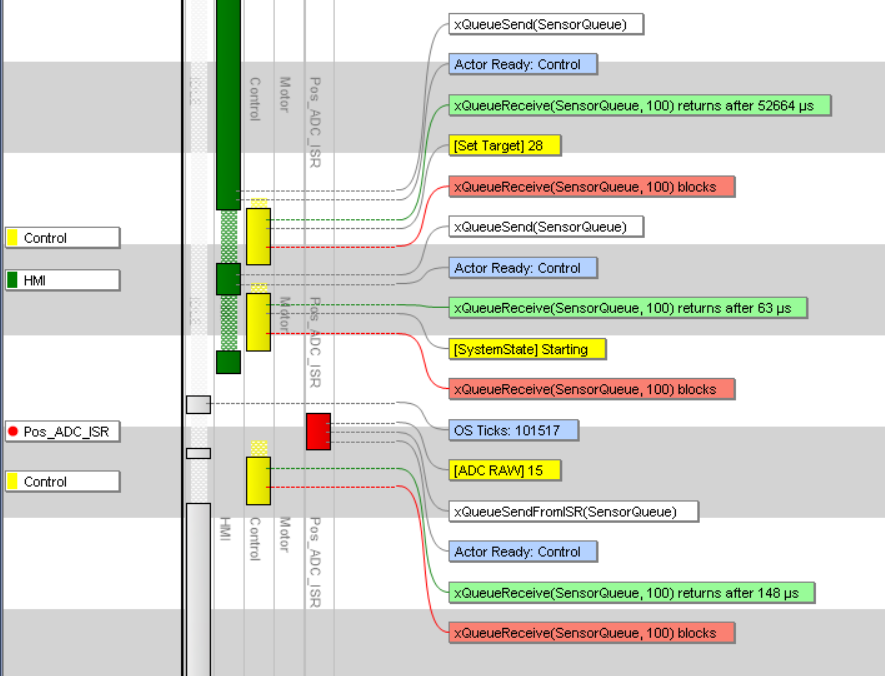 User Events
Log any event or data in your application with minimal overhead. Appears as yellow labels in the trace view, and also shown in the event log.