Getting Started with Percepio Profile on FreeRTOS
Percepio Profile relies on Percepio TraceRecorder to provide trace data. This library is provided in the Percepio Profile installation folder and needs to be added to your project. Percepio Profile supports trace streaming via SEGGER J-Link RTT and also snapshot tracing. For instructions on snapshot tracing, please refer to the Percepio View guide. Percepio Profile supports x86-64 computers running Windows or Linux. Arm-based host computers are not yet supported.
If you prefer a different method for trace streaming, or want to record very long traces, please consider upgrading to Percepio Tracealyzer.
Installing the application
- Windows: Download and run the installer.
- Linux: Download the archive. The standalone version is recommended for most users. Then refer to the Running Tracealyzer on Linux guide. Start the application by running ./launch-tz.sh.
Adding TraceRecorder in your project
1. Locate the TraceRecorder folder in your Percepio View installation. This is found in the “FreeRTOS” directory. A shortcut is available in the Help menu.
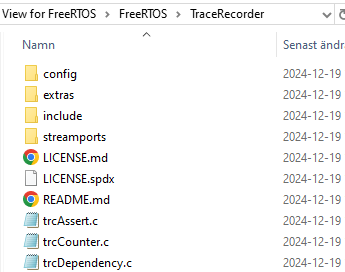
2. Copy the the following source files to your project and make sure they are included in your build:
- TraceRecorder/*.c
- TraceRecorder/streamports/Jlink_RTT/*.c
3. Copy the following directories to your project and add them in your “include paths”:
- TraceRecorder/include
- TraceRecorder/config
- TraceRecorder/streamports/Jlink_RTT/include
- TraceRecorder/streamports/Jlink_RTT/config
4. In config/trcConfig.h: Remove this line #error “Trace Recorder: Please include your processor’s header file here and remove this line.”. This is just a reminder. For some hardware ports (e.g. Arm Cortex-M), you need to add your processor include file (for example “stm32l4xx.h”) and this is a suitable place for it. If you are uncertain, skip this #include to begin with. If TraceRecorder builds without errors, this include is not needed.
5. In config/trcConfig.h set TRC_CFG_HARDWARE_PORT to a “hardware port” matching your processor. For Arm Cortex-M devices, use TRC_HARDWARE_PORT_ARM_Cortex_M. All available hardware ports are listed in include/trcDefines.h. If you don’t find a match for your processor type, you can make your own hardware port, or you may contact Percepio about commercial engineering services.
6. In config/trcKernelPortConfig.h, set TRC_CFG_FREERTOS_VERSION to match your FreeRTOS version. Check your FreeRTOS source files if you are uncertain.
7. In FreeRTOSConfig.h, make sure that configUSE_TRACE_FACILITY is set to 1. If not defined, add #define configUSE_TRACE_FACILITY 1.
8. In FreeRTOSConfig.h, add #include “trcRecorder.h” in the end (after all #defines).
Note: If using IAR Embedded Workbench, use the following code:
#ifndef __IASMARM__
    #include "trcRecorder.h"
#endif
Note: If using Microchip MPLAB X IDE, use the following code:
#ifndef __LANGUAGE_ASSEMBLY
    #include "trcRecorder.h"
#endif
9. Add a call to xTraceInitialize() to initialize the TraceRecorder library. This call should be placed as early as possible during the startup, typically at the first line of your main() function. It must be called before any traced FreeRTOS calls occur. This doesn’t start the actual tracing.
10. Call xTraceEnable(<start option>) to enable the tracing. There are three start options:
- TRC_START_FROM_HOST: This lets you start the tracing interactively from the Percepio Profile host application. You can connect with Percepio Profile at any point after this call.
- TRC_START_AWAIT_HOST: Like TRC_START_FROM_HOST, but blocks until you start the tracing in Percepio Profile. This is useful for tracing the startup of your device. Make sure to call xTraceEnable before starting the FreeRTOS scheduler.
- TRC_START: Starts the tracing right away, without waiting for a start command from the host application. To use this approach, it is recommended to put a breakpoint right after the xTraceEnable, connect with Percepio Profile when at the breakpoint, and start the tracing session, then finally resume execution.
11. In Percepio Profile, open File -> Settings -> Project Settings -> J-Link Settings and update as described below.
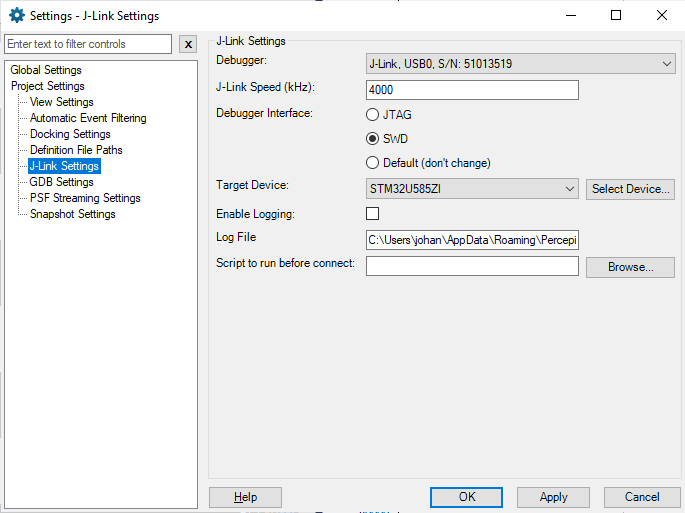
- J-Link speed: start with the default (4000 KHz), but can be increased if needed.
- Debugger Interface: Set JTAG or SWD. If another debug tool is used at the same time, make sure to use the same setting in both tools.
- Target Device: Specify the target device. Note that the list of devices comes from the J-Link driver.
- Enable logging: This refers to low-level logging in the J-Link driver. Normally this can be disabled to reduce system load, but can be useful for troubleshooting.
12. In Percepio Profile, open File -> Settings -> Project Settings -> PSF Streaming Settings and update as described below.
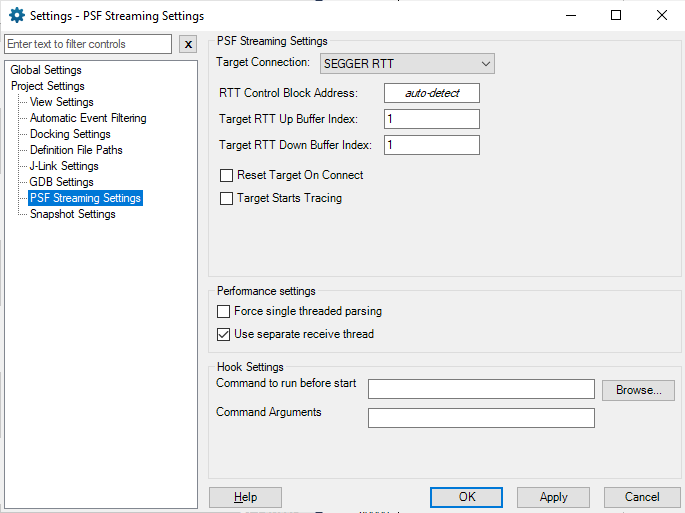
- Target Connection: SEGGER RTT
- RTT Control Block Address: “auto-detect” (= 0)
- Target RTT Up Buffer Index: 1
- Target RTT Down Buffer Index: 1
- Reset Target on Connect: Disabled
- Target Starts Tracing – this depends on your “start option” provided to xTraceEnable:
- TRC_START_FROM_HOST: “Target Starts Tracing” should be Disabled
- TRC_START_AWAIT_HOST: “Target Starts Tracing” should be Disabled
- TRC_START: “Target Starts Tracing” should be Enabled
- Use separate receiver thread: Enabled (may improve throughput)
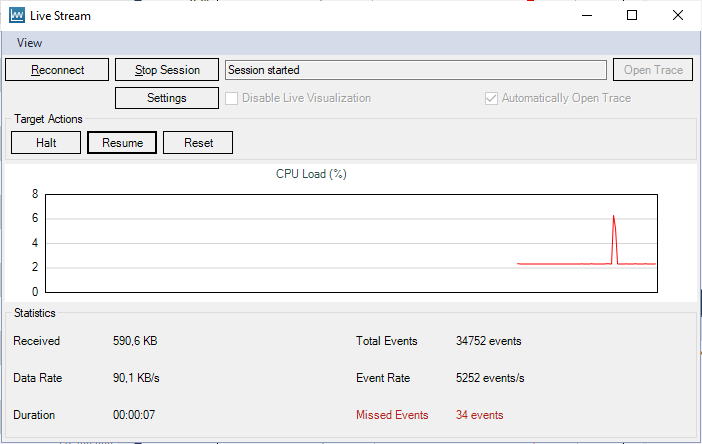
13. In Percepio Profile, open File -> Trace -> Open Live Stream Tool.
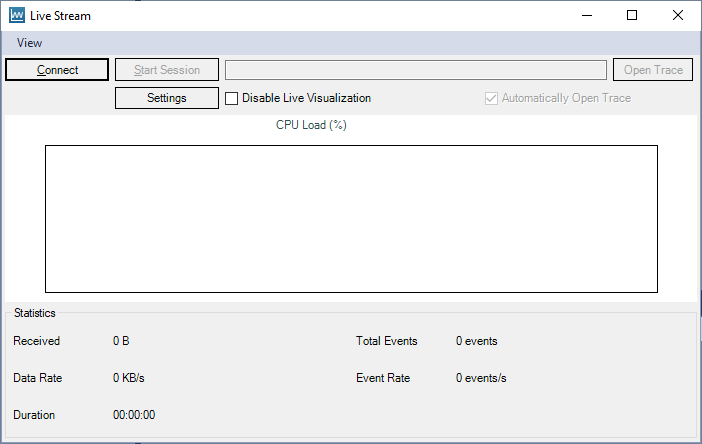
Click Connect and then Start Session. The live visualization should begin, unless disabled by the checkbox. Disabling the live visualization reduces the load on the host system.
Record your test case, and then select Stop Session to finalize the trace and enable all views.
While recording, make sure to check for “Missed Events”. If you see a notice in red (like in the below screenshot), some events have been lost during the trace streaming. In that case, make sure to resolve such issues before studying the trace in detail. A complete trace is needed for accurate display. See links in the Troubleshooting section below.
Troubleshooting
In case of issues with the J-Link streaming, please consult the troubleshooting guide at https://percepio.com/troubleshoot-j-link-rtt. More troubleshooting tips are found in the Percepio Profile User Manual (Help menu) under “Creating and Loading Traces” -> “Percepio TraceRecorder” -> “Troubleshooting”
Questions
If you have technical questions, please post them in the FreeRTOS Forum. Make sure to set “Percepio” as category.