Getting Started with Percepio View for Zephyr
Percepio View is a free of charge tracing tool for Zephyr applications, based on Percepio Tracealyzer.

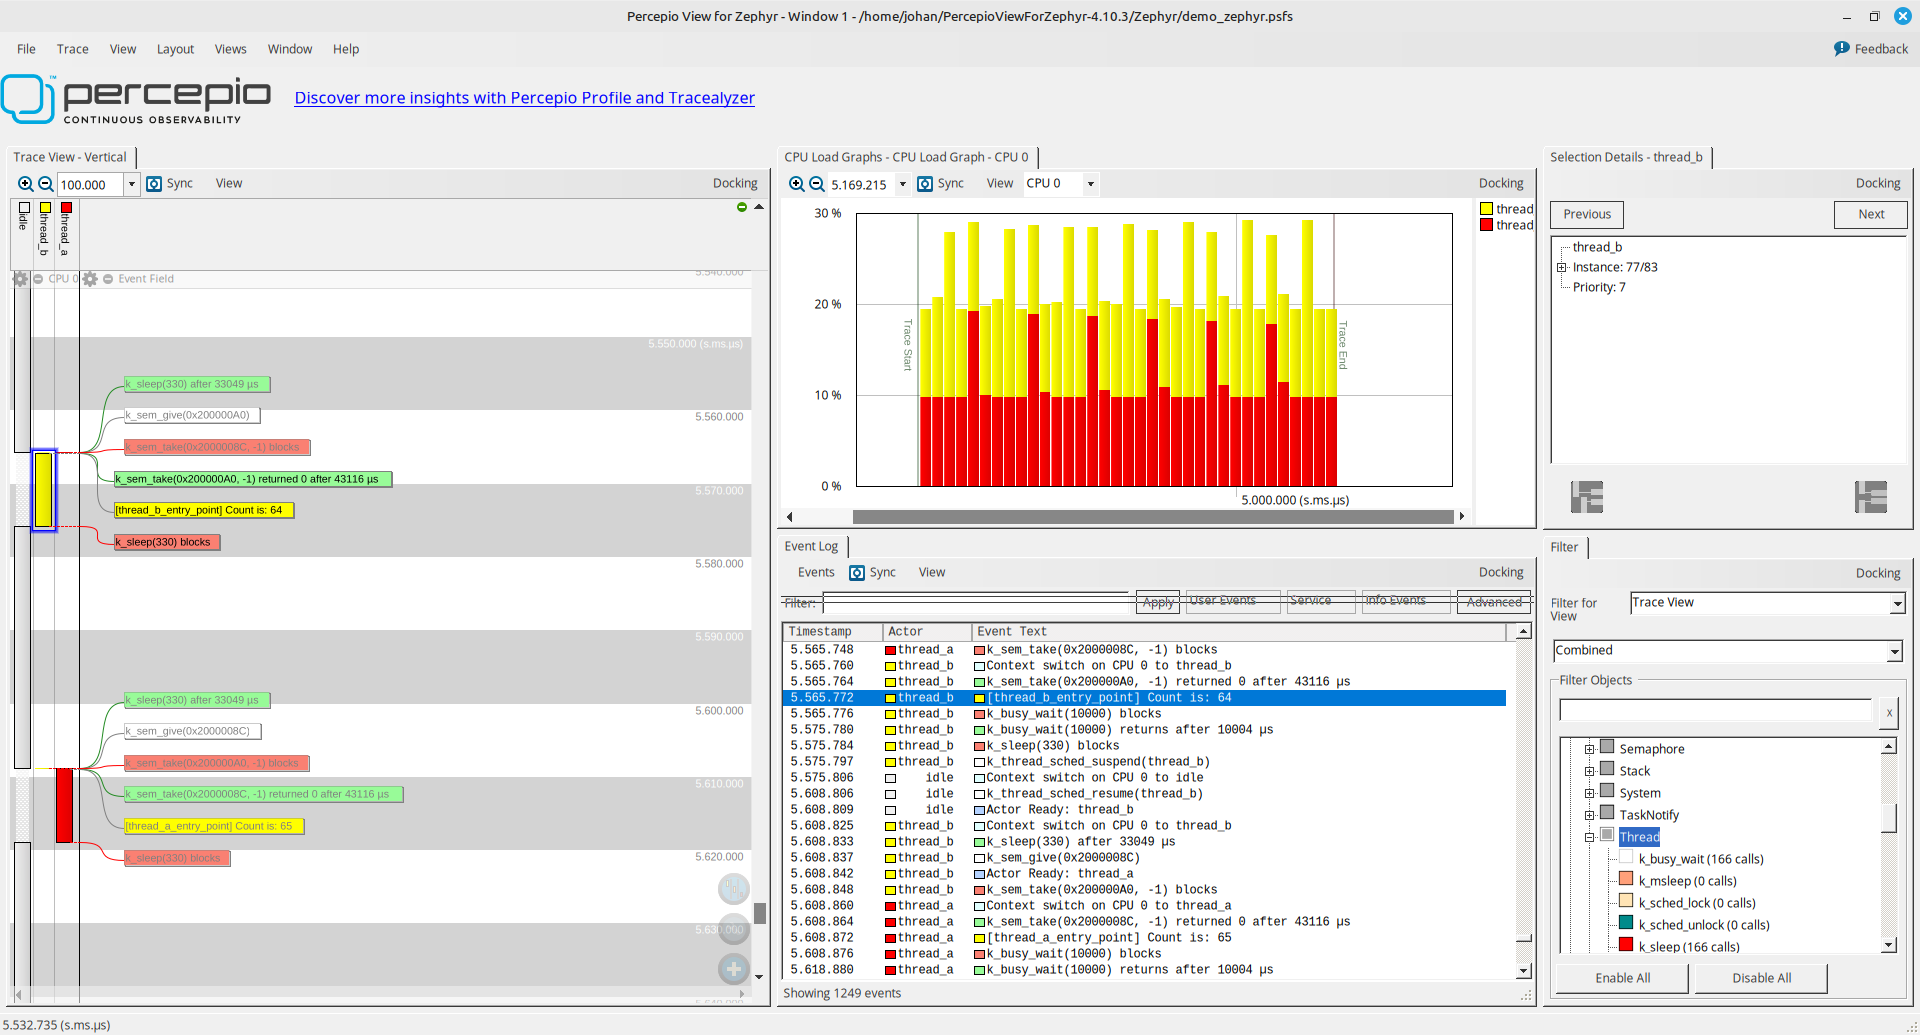
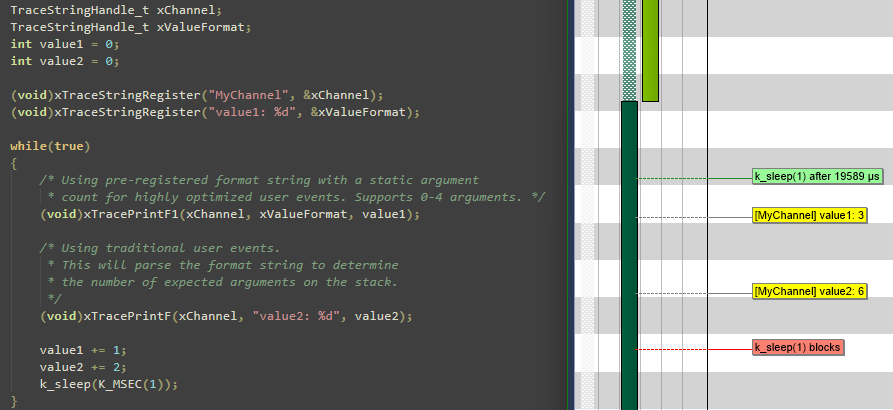
Percepio View lets you record Zephyr kernel events and visualize the thread execution. You can also call the tracing library directly to log additional user events. This lets you visualize kernel events and application events together. Moreover, the user event logging is very fast and often a superior alternative to printf logging.

Percepio View is limited to snapshot tracing, where the events are stored in a target-side memory buffer. This is intended for verification of the system execution and for debugging, in combination with breakpoints. For example, if you set a breakpoint in an error handler, a snapshot trace can show the sequence of events leading up to the error.
To record long traces by real-time trace streaming, consider upgrading to Percepio Profile or Percepio Tracealyzer.
Percepio View supports x86-64 computers running Windows or Linux. Arm-based host computers are not yet supported.
Installing the application
Visit the Percepio View product page to download the application. For Linux users, the “standalone” package is recommended for most users. Linux users should also refer to the Running Tracealyzer on Linux guide to get started. Start the application by running ./launch-tz.sh.
Next, register to enable additional features, such as user event logging and the CPU load graph. This is optional, but having the user event logging is important for debugging use-cases.
Recording traces with Percepio View
Percepio View relies on Percepio TraceRecorder to provide trace data. TraceRecorder is available as a submodule in the Zephyr repository and can be enabled in your project as described below.
To enable tracing for Percepio View (the ring buffer option), make sure to have the following configuration options in your prj.cnf:
CONFIG_TRACING=y
CONFIG_PERCEPIO_TRACERECORDER=y
CONFIG_PERCEPIO_TRC_CFG_STREAM_PORT_RINGBUFFER=y
CONFIG_PERCEPIO_TRC_CFG_STREAM_PORT_RINGBUFFER_SIZE=<size in bytes>
Or if using menuconfig
- Enable ‘Subsystems and OS Services –> Tracing Support’
- Under ‘Subsystems and OS Services –> Tracing Support –> Tracing Format’, select `Percepio Tracealyzer`
- Under ‘Modules –> percepio –> TraceRecorder –> Stream Port’, select ‘Ring Buffer’
- Under ‘Modules –> percepio –> TraceRecorder –> Ring Buffer Config –> Buffer Size’, set the buffer size in bytes.
The default buffer size can be reduced if you are tight on RAM, or increased if you have RAM to spare and want to be able to capture longer traces. You may also optimize the Tracing Configuration settings to get longer traces by filtering out less important events. In menuconfig, see ‘Subsystems and OS Services –> Tracing Support –> Tracing Configuration’.
More detailed information on TraceRecorder configuration for Zephyr can be found here.
Saving and Viewing Traces
In Percepio View, add the path to your Zephyr build folder in File -> Settings -> Project Settings -> Definition File Paths.
This folder should contain a file “syscalls-[version].xml” created during build.
Build and flash the device, then start a debug session. Run for a while and halt the device, e.g. on a breakpoint. Note that you can use your debugger and set breakpoints as usual during the tracing session. Halting the device won’t affect the trace, as time effectively ‘pauses’ when the debugger halts the core.
If using a GCC toolchain, open the debug console in your IDE, where you can type in GDB commands, and run the following gdb command:
dump binary value trace.bin *RecorderDataPtrIf using VS Code, you need to add ‘-exec’ before the gdb command.
-exec dump binary value trace.bin *RecorderDataPtrYou can also use west to start your debugger (‘west debug’) and run the GDB command:
dump binary value trace.bin *RecorderDataPtrThe resulting trace.bin file is typically found in the root of the build folder, unless a different path has been specified. Open trace.bin in Percepio View by selecting ‘File –> Open –> Open File’.
For more frequent use, you can configure Percepio View to automate the GDB trace capture, using the “Take Snapshot” button in the GUI. For setup instructions, see this page, under “Using the Tracealyzer GDB integration”.
Questions
If you have issues getting started, please refer to Zephyr Github Discussions page and search for Percepio.
