Compare Percepio Tracing Products
Percepio View
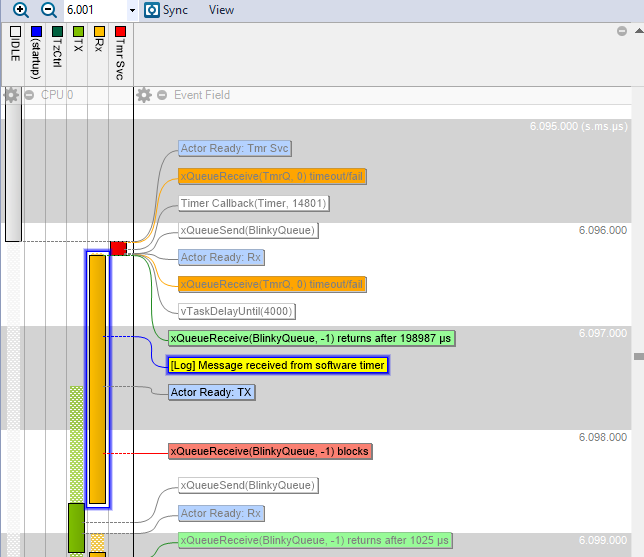
Percepio View is a free tool based on Percepio Tracealyzer, designed to help you inspect and debug RTOS-based embedded software. The advanced trace visualization makes it far easier to understand software issues involving multiple threads, timing and software performance. It works alongside traditional debugging tools by using the debug connection to read trace data from a device RAM buffer. Percepio View offers snapshot tracing and a core set of Tracealyzer views, streamlined for simplicity.
Trace View
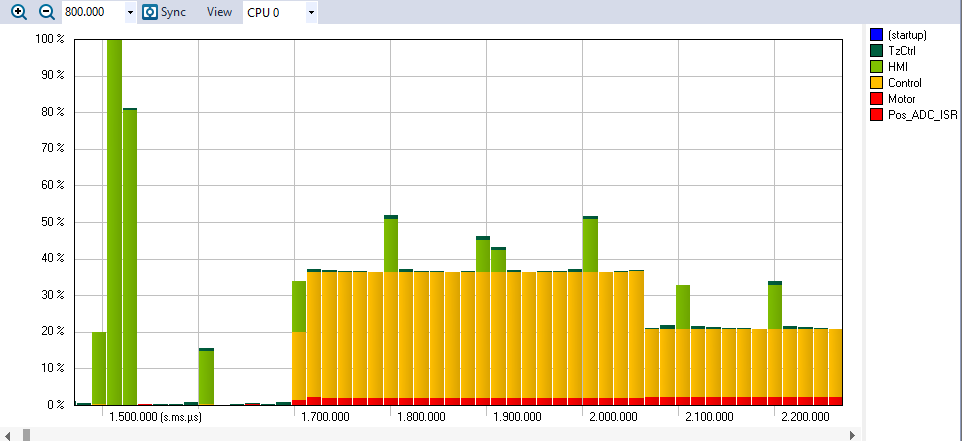
CPU Load Graph
Shows the relative amount of CPU time used by each task/thread and interrupt handler, as well as total CPU usage. Find hotspots with high CPU load, where code optimizations can bring the largest performance improvements.
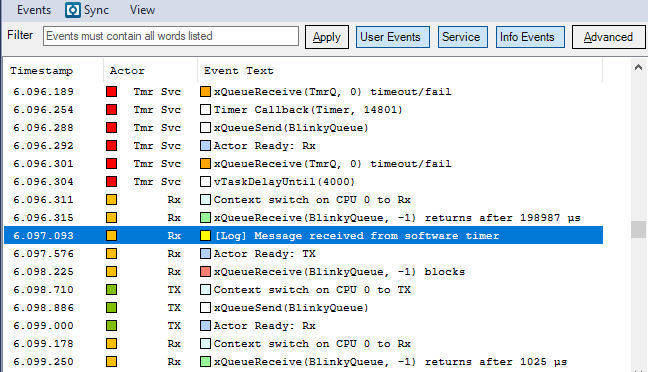
Event Log
Shows a list of the logged events, including both kernel events and user events. Easy to search and filter. Double-click to highlight events in the trace view, for example custom user events logged in your application code.
Percepio Profile
Upgrade to Percepio Profile to get all features from Percepio View plus SEGGER J-Link trace streaming support, as well as profiling features such as thread timing metrics, memory usage profiling and visual data plots of application data.
Trace streaming
Percepio Profile supports trace streaming using the RTT feature of your SEGGER J-Link probe. Record long traces and see animated real-time views during tracing sessions.
The trace length is mainly limited by the amount of host memory needed to load and analyze the trace. In practice you can view traces of 10-60 minutes, depending on your application’s event rate and the amount of host memory available.
If you like to stream the trace data in other ways, and for improved long trace support, please consider upgrading to Percepio Tracealyzer.
Communication Flow
This view shows a summary of the runtime interactions between your threads, such as IPC and synchronization events. See what threads that are using a certain RTOS object, for example a mutex, semaphore or queue. Double-click to see the events.

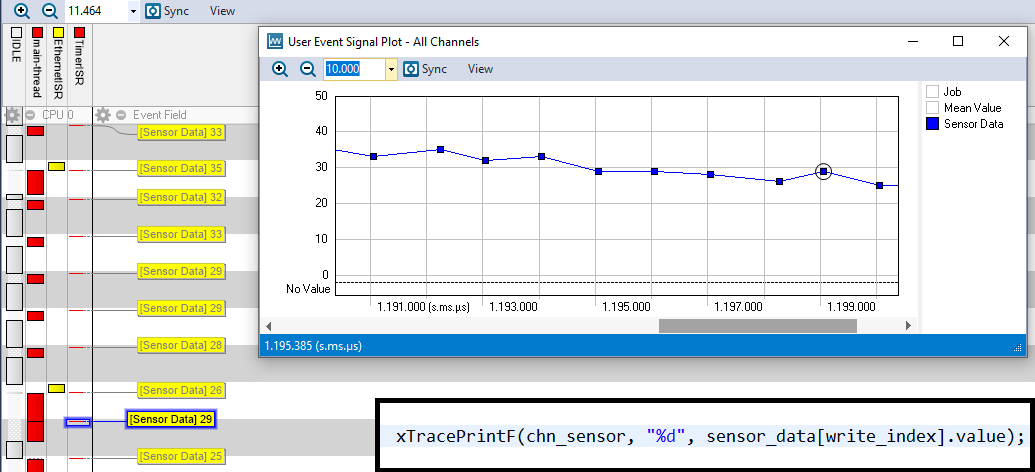
User Event Signal Plot
Visualizes logged user event data as a plot over time. Toggle the visibility of each user event channel in the right-side legend. Double-click on data points to show the corresponding event/sample in the trace.
Data logging with user events is typically hundreds of times faster than printf calls, allowing for extensive logging with minimal overhead.
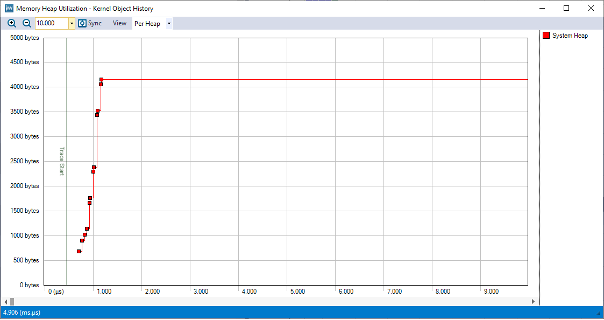
Heap Usage
See dynamic memory allocation (malloc/free) over time to optimize your heap size and check if you might have memory leaks. Double-click the data points to find the corresponding memory allocations in the trace view.
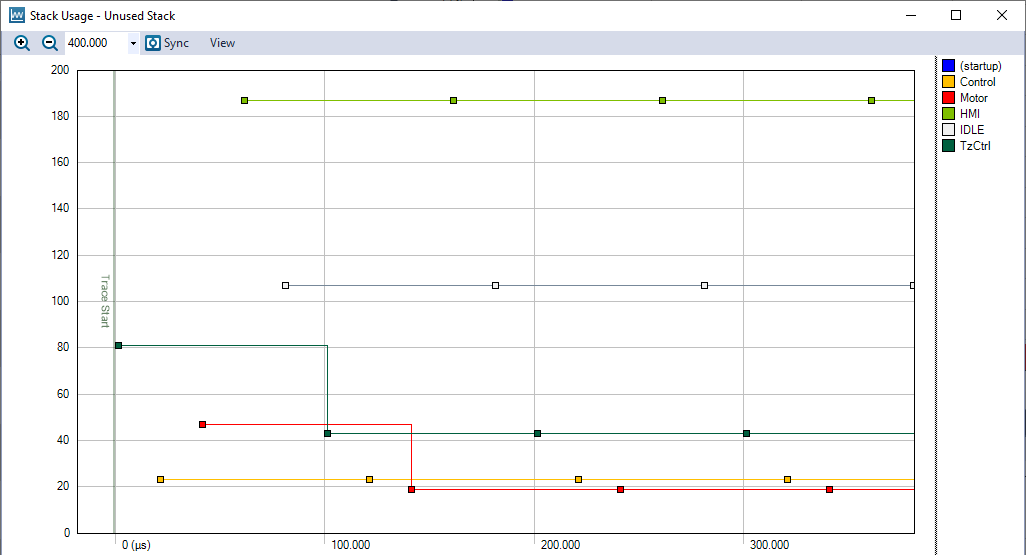
Stack Usage
Monitor the amount of unused stack for each thread, as a plot over time. Make sure you have enough safety margins to avoid stack overflow, while not being too large and wasting too much of your precious RAM.
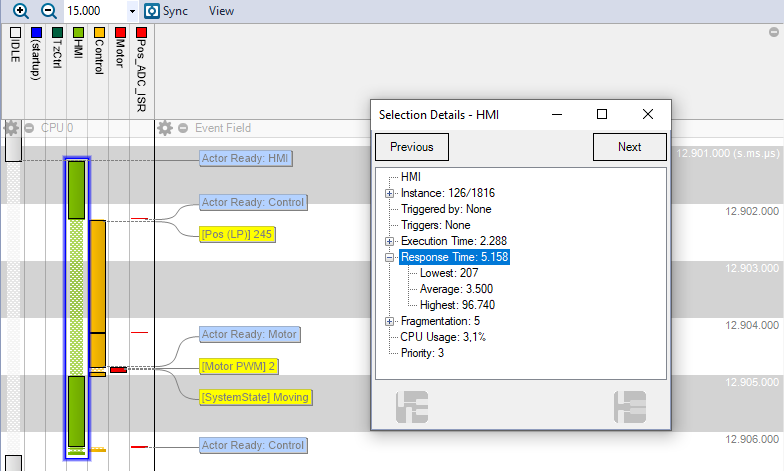
Timing Metrics
See statistics on thread execution times and response times per job. Double-clicking an extreme value navigates the trace view to the corresponding job. This lets you see the situations where the software latency is higher than normal.
Percepio Tracealyzer
Upgrading to Percepio Tracealyzer provides a wealth of analysis features, productivity improvements and customization options, in addition to all features from View and Profile. This provides a very powerful analysis toolbox that lets you debug, verify and optimize your code on a whole new level. ↟
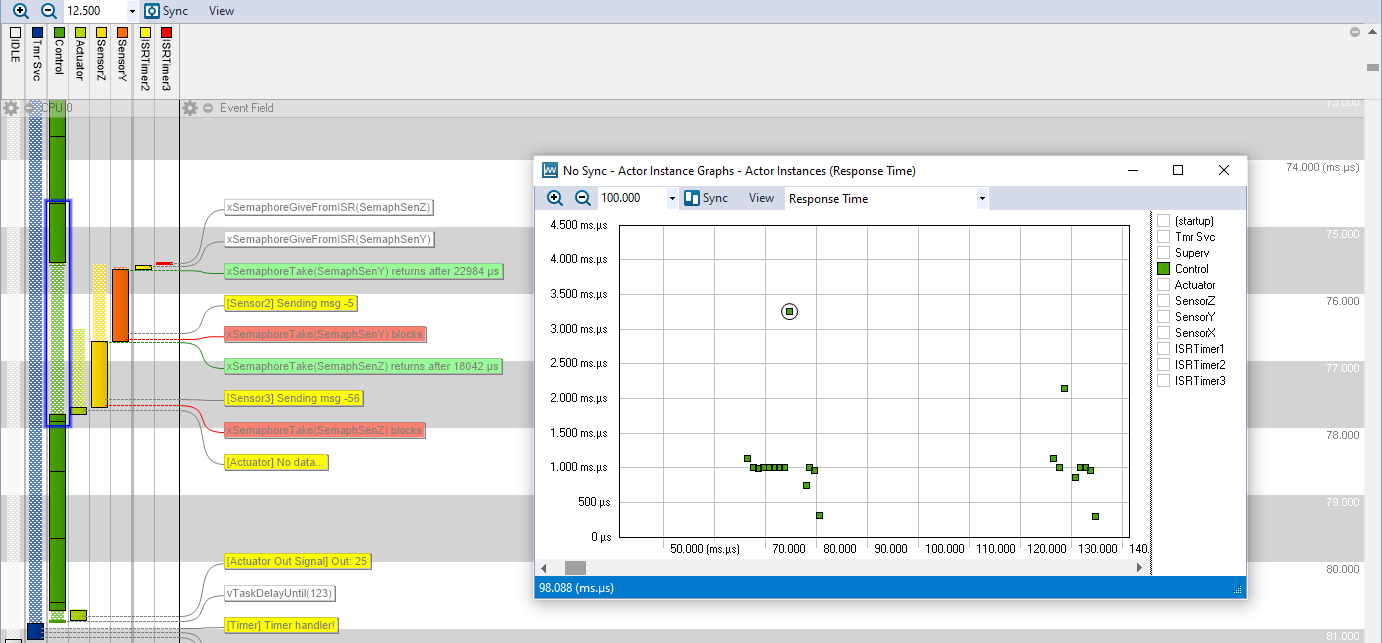
Instance Graphs
See the variations in thread timing and scheduling, e.g. execution times, response times, and periodicity. Optimize for reliable real-time performance, stability and testability.
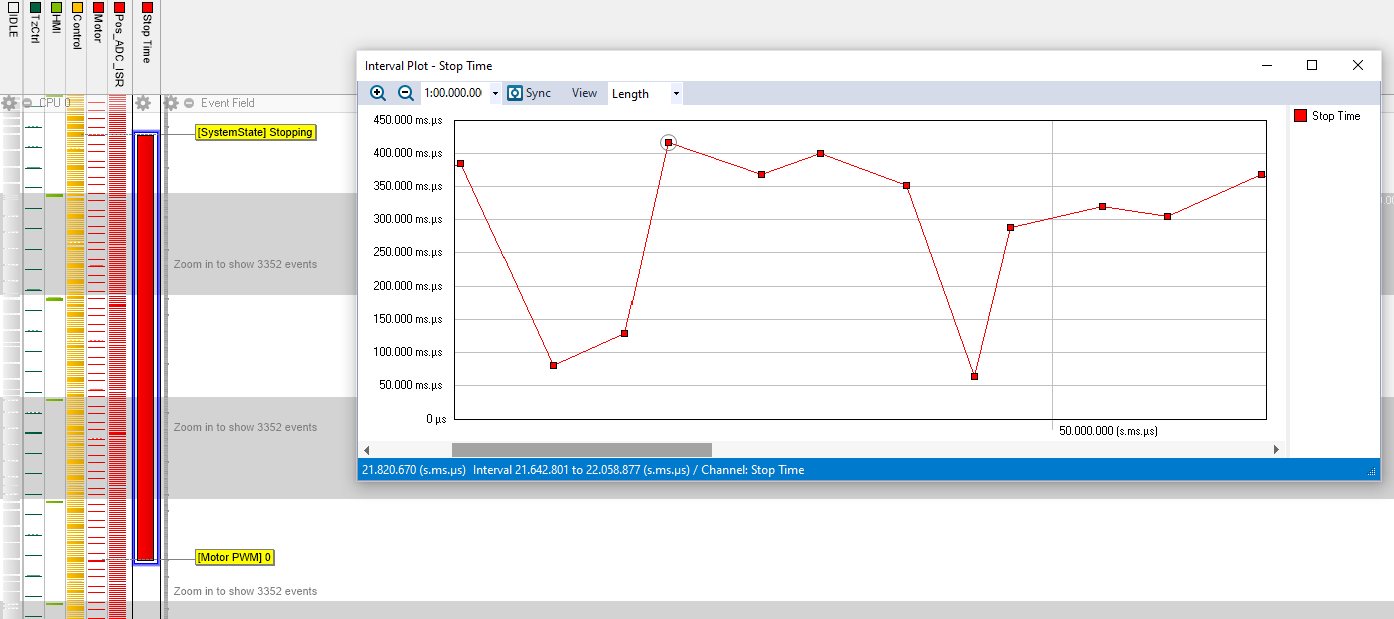
Interval Tracing
Profile and visualize the time between two logged events in the code, also across threads and interrupts.
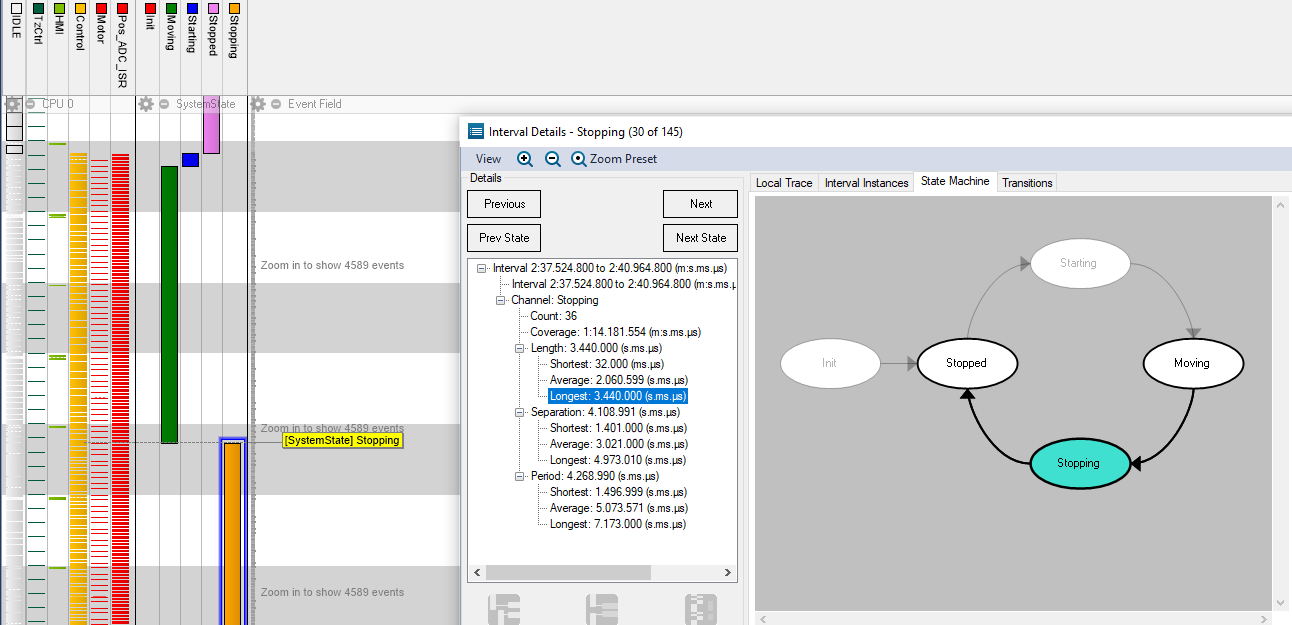
State Machine Tracing
Visualize logged state transitions of any kind, both in the trace view and as state diagrams. States can also be profiled in the same way as intervals.
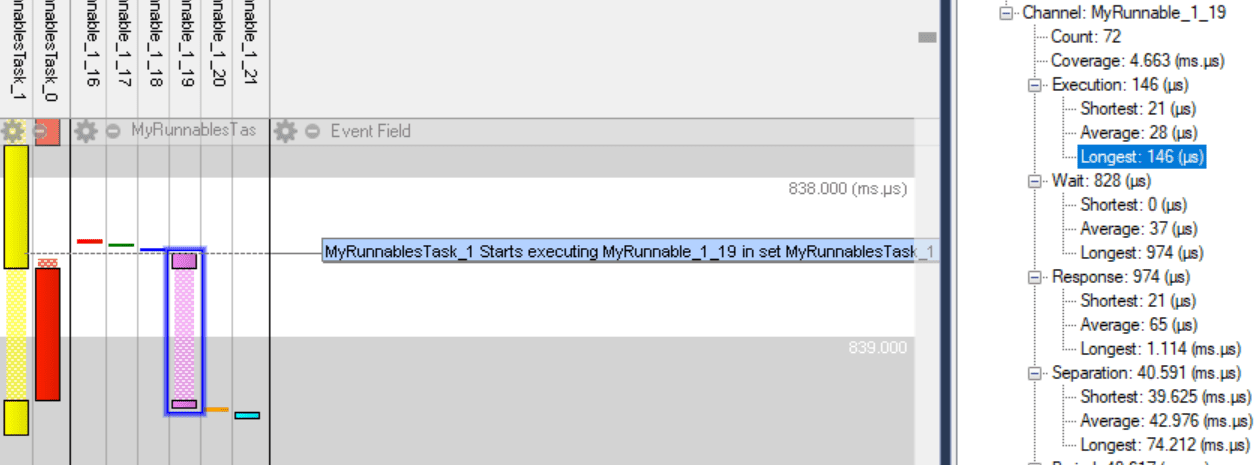
Runnable Tracing
Profile and visualize sections of code within a single thread, for example important functions or cases in a switch statement. Unlike intervals, runnables are bound to a specific thread and provide the execution time within the thread, excluding preemptions.
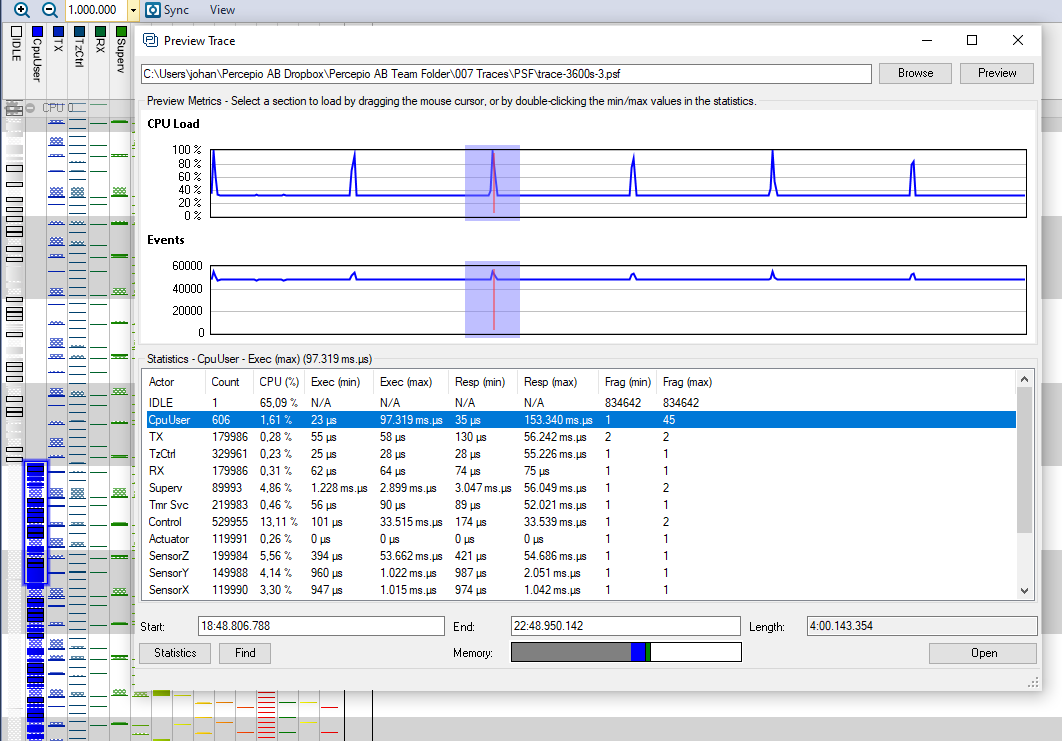
Unlimited Trace Support
Preview very large traces file in seconds, find relevant sections and load only that part for detailed analysis. This allows for analyzing traces of practically unlimited length, with minimal memory consumption and load time.
Statistics Report
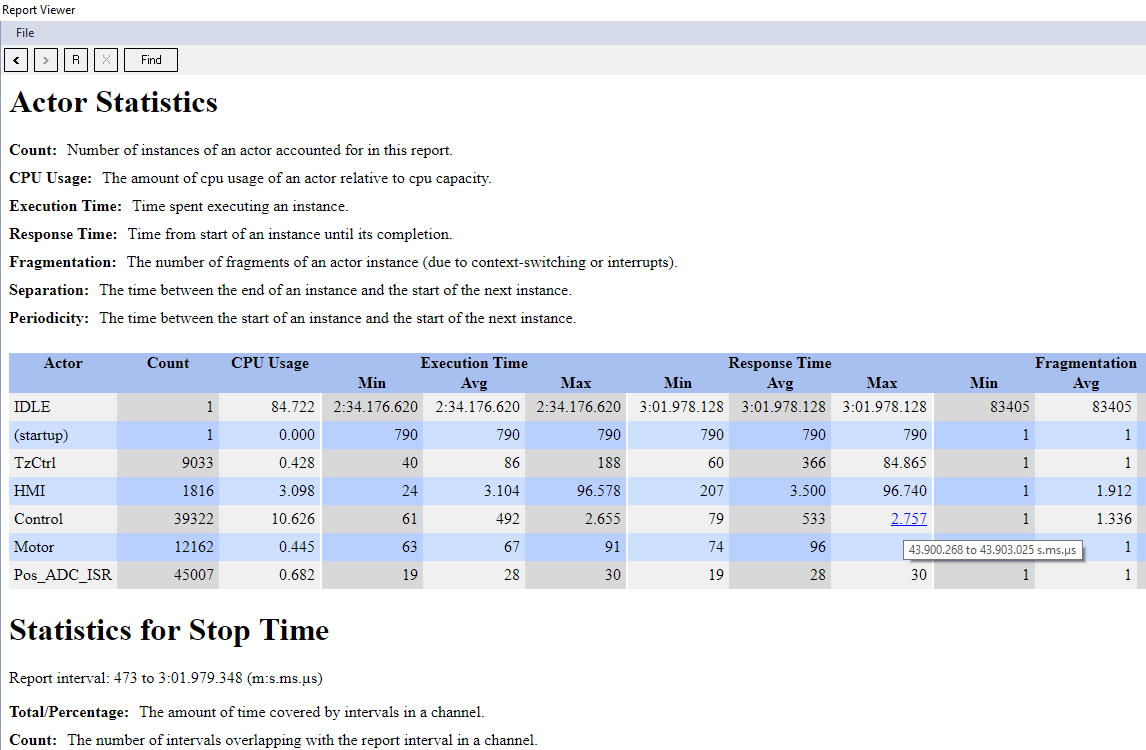
Generate and export reports for thread timing metrics, custom intervals, states and runnables. Clicking on Min and Max values shows the specific instance in the trace view.
Advanced RTOS Analytics
See plots of various RTOS-related performance metrics, such as IPC message latency, IPC blocking time, dynamic priority changes, queue utilization, service call intensity, et cetera.
ELF Support
More efficient tracing by leveraging your ELF file created at the build. When used, constant strings (like User Event messages) can be logged as an address only, instead of a sequence of characters. This means fewer bytes emitted and faster event logging. This feature is required for using the xTracePrintCompact logging functions in Percepio TraceRecorder.
Data Export
Export the event log, user event plot and statistical data in text, XML and CSV formats.
Multiple RTOSes Supported
All TraceRecorder integrations maintained by Percepio are supported, including bare metal, FreeRTOS, Zephyr, ThreadX and others.
Tracealyzer SDK
The Tracealyzer SDK enables customers and partners to create custom Tracealyzer extensions for any C/C++ software and take full advantage of the powerful capabilities in Percepio Tracealyzer, regardless of the RTOS used (if any). Moreover, the SDK allows for extending the Tracealyzer observability beyond RTOS events, for example by adding instrumentation in communication stacks, peripheral drivers and other important C/C++ APIs in your application.
Note that developing custom SDK extensions is not needed if you intend to use Tracealyzer with an RTOS that is already supported by Percepio.
Linux Tracing
Trace your Linux systems with LTTng and visualize in Tracealyzer. Note that the features differ compared to TraceRecorder traces. Some views designed with RTOS APIs in mind are not populated by default, but additional Linux-related views are provided like the “Signals and Syscall Explorer”.
Floating Licenses
Use Tracealyzer on any computer in your network, without binding the license to a single machine.
Project Settings for Multiple Targets
Have separate Tracealyzer settings for multiple target systems and switch between them easily.
Trace Streaming Via Any Interface
Stream the trace data using any I/O interface available on your device, like TCP and UDP using lwIP. Make your own custom “stream port” module to output the trace data anyway you like.
Technical Support
Need help to get started, or have questions on your specific use-cases? Get responsive ticket-based support from our experienced product specialists here.
